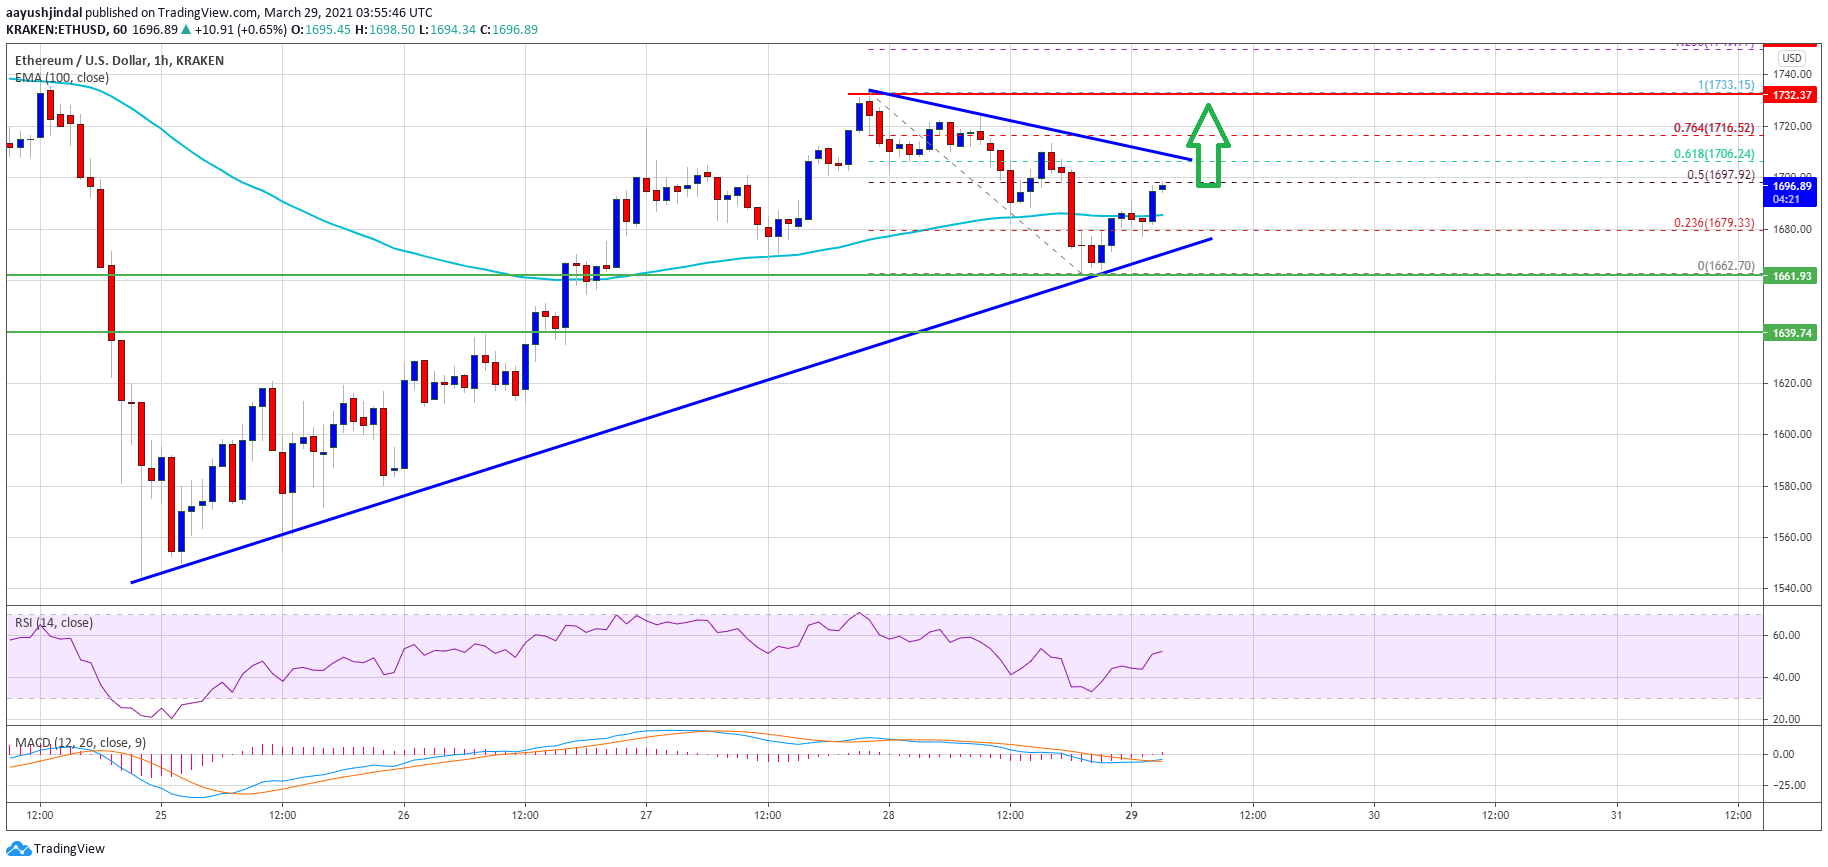
Ethereum recovered above $1,700 and it even tested $1,730 against the US Dollar. ETH price is showing positive signs, but it must settle above $1,720 for a sustained upward move.
- Ethereum gained traction after there was a close above the $1,600 level.
- The price is now above the $1,650 resistance and the 100 hourly simple moving average.
- There is a key bullish trend line forming with support near $1,675 on the hourly chart of ETH/USD (data feed via Kraken).
- The pair could start a strong rally if there is a clear break above $1,710 and $1,730.
Ethereum Price Turns Green
Ethereum found support near the $1,550 zone and started a steady increase, similar to bitcoin. ETH cleared a few important hurdles near $1,600 and $1,620 to move into a positive zone.
The main hurdle cleared was near $1,650 and the 100 hourly simple moving average. The price even climbed above the $1,700 level. A high was formed near the $1,733 level before there was a downside correction.
There was a break below the $1,700 level, but the price remained stable near the $1,660 level. A low is formed near $1,662 and the price is rising. It is now above the $1,650 resistance and the 100 hourly simple moving average.
There is also a key bullish trend line forming with support near $1,675 on the hourly chart of ETH/USD. An immediate resistance is near the $1,700 level. It is close to the 50% Fib retracement level of the downward move from the $1,733 high to $1,662 low.
Source: ETHUSD on TradingView.com
The first key resistance is near a connecting bearish trend line at $1,710 on the same chart. The trend line is close to the 61.8% Fib retracement level of the downward move from the $1,733 high to $1,662 low.
A clear break above the $1,700 and $1,710 levels could set the pace for a strong increase. In the stated case, the price is likely to visit the $1,750 and $1,780 levels.
Fresh Decline in ETH?
If Ethereum fails to climb above the $1,700 and $1,710 resistance levels, it could start a fresh decline. An initial support on the downside is near the $1,685 level and the 100 hourly SMA.
The first key support is near the $1,675 level and the trend line. The main support is near the $1,650 level. A clear downside break below the $1,650 support could lead the price towards the $1,550 level.
Technical Indicators
Hourly MACD – The MACD for ETH/USD is gaining momentum in the bullish zone.
Hourly RSI – The RSI for ETH/USD is now above the 50 level.
Major Support Level – $1,650
Major Resistance Level – $1,720
from NewsBTC https://ift.tt/3ct8iNp
https://ift.tt/3ftdtPr


No comments:
Post a Comment