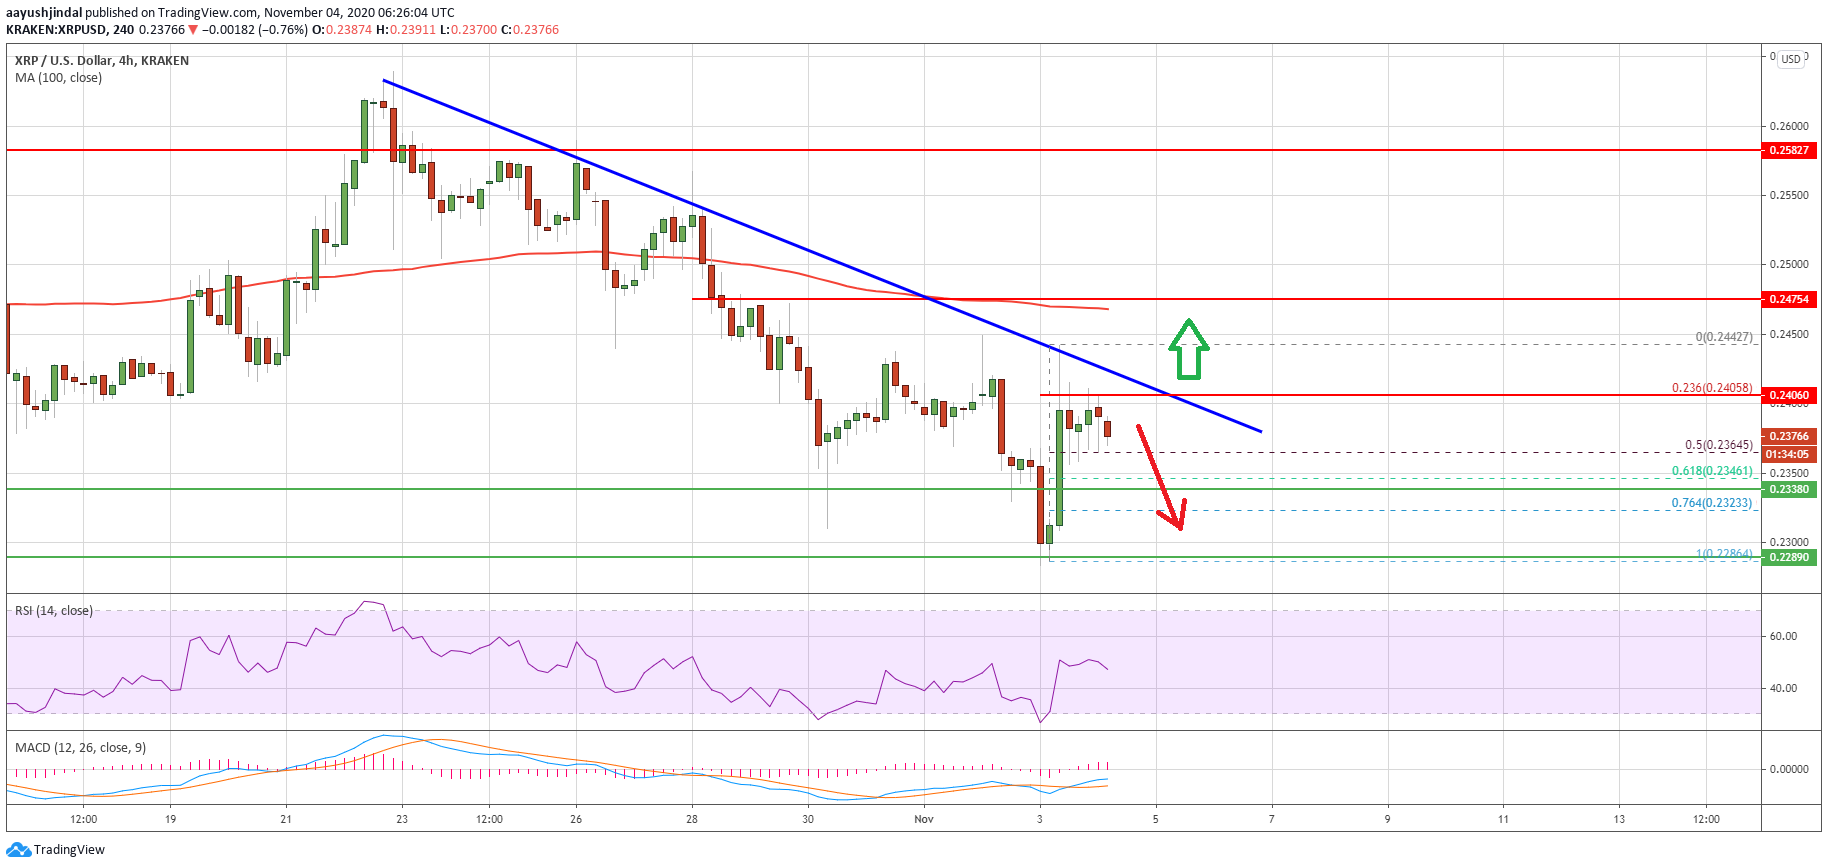
Ripple started an upside correction from the $0.2280 support against the US Dollar. XRP price could start a strong rally if it clears the $0.2400 resistance zone.
- Ripple is struggling to gain bullish momentum above the $0.2400 resistance against the US dollar.
- The price is now trading well above $0.2350 and the 100 simple moving average (4-hours).
- There is a crucial bearish trend line forming with resistance near $0.2400 on the 4-hours chart of the XRP/USD pair (data source from Kraken).
- The pair could start a strong rally if it clears the $0.2400 and $0.2440 levels in the near term.
Ripple’s XRP Price is Facing Hurdles
In the past few days, there was a steady decline in ripple’s XRP price below the $0.2500 support. The price even broke the $0.2400 support zone and settled well below the 100 simple moving average (4-hours).
It even spiked below the $0.2300 support level. A low is formed near the $0.2286 level and the price is currently recovering. Besides, there was a strong increase in bitcoin above $13,800 and ETH also climbed above $385, but XRP is facing a lot of hurdles.
It seems like the bulls are facing an uphill task near the $0.2400 and $0.2440 levels. A high is formed near $0.2442 and the price is declining. There is also a crucial bearish trend line forming with resistance near $0.2400 on the 4-hours chart of the XRP/USD pair.
Source: XRPUSD on TradingView.com
An initial support is near the $0.2365 level. It is close to the 50% Fib retracement level of the recent upward move from the $0.2286 low to $0.2442 high.
The first major support is near the $0.2350 level or the 61.8% Fib retracement level of the recent upward move from the $0.2286 low to $0.2442 high. On the upside, the price is clearly facing a huge resistance near $0.2400. To start a strong rally, the price must break the trend line resistance and then gain pace above $0.2440.
Key Breakdown Support for XRP
If ripple fails to clear the $0.2400 and $0.2440 resistance levels, there is a risk of a bearish breakdown. The first key support is near the $0.2350 level.
The next major support is near the $0.2300 zone and the $0.2286 swing low. A clear break below the $0.2286 low is likely to spark a sharp decline towards $0.2200 or even $0.2120 in the near term.
Technical Indicators
4-Hours MACD – The MACD for XRP/USD is slowly moving in the bullish zone.
4-Hours RSI (Relative Strength Index) – The RSI for XRP/USD is now struggling to settle above the 50 level.
Major Support Levels – $0.2365, $0.2350 and $0.2300.
Major Resistance Levels – $0.2400, $0.2440 and $0.2500.
from NewsBTC https://ift.tt/3oYIhtI
https://ift.tt/3eq9HDG


No comments:
Post a Comment